Agnes SmansinProject Data Visualization UHasseltFinal visualisationFinal implementationMay 28, 2021May 28, 2021
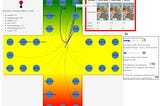
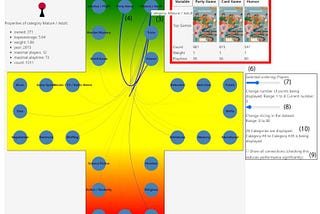
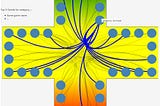
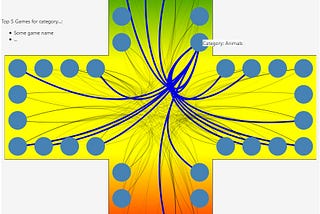
Agnes SmansinProject Data Visualization UHasseltSecond intermediate implementationAs we mentioned in our previous blog post, we were going to combine all our different implementation elements, including the connections…May 3, 2021May 3, 2021
Agnes SmansinProject Data Visualization UHasseltIntermediate implementationsAs we mentioned in our previous blog post, our programming/implementation ‘game’ has finally started. In this post, we describe the first…Apr 21, 2021Apr 21, 2021
Agnes SmansinProject Data Visualization UHasseltFeedback on blogsThis is our feedback on the data visualisation of other groups’ blogs. For group ABBDJ, considering the soccer…Apr 2, 2021Apr 2, 2021
Agnes SmansinProject Data Visualization UHasseltDesigning our visualisationOur research question & visualisation journeyMar 29, 2021Mar 29, 2021
Agnes SmansinProject Data Visualization UHasseltData selectionThe data that we decided to use concerns the 2020 ratings of board games derived from the website www.boardgamegeek.com, as well as the…Mar 27, 2021Mar 27, 2021
Agnes SmansinProject Data Visualization UHasseltA deep dive into board games. A journey for the data visualisation project.“Once upon a time, there was a University in the kingdom of Belgium with some students urging for visual stimulus”…Mar 23, 2021Mar 23, 2021